 F-14/15, Orbit Mall, Civil Lines, Jaipur-302006
 support@thetaxheaven.com
F-14/15, Orbit Mall, Civil Lines, Jaipur-302006 support@thetaxheaven.com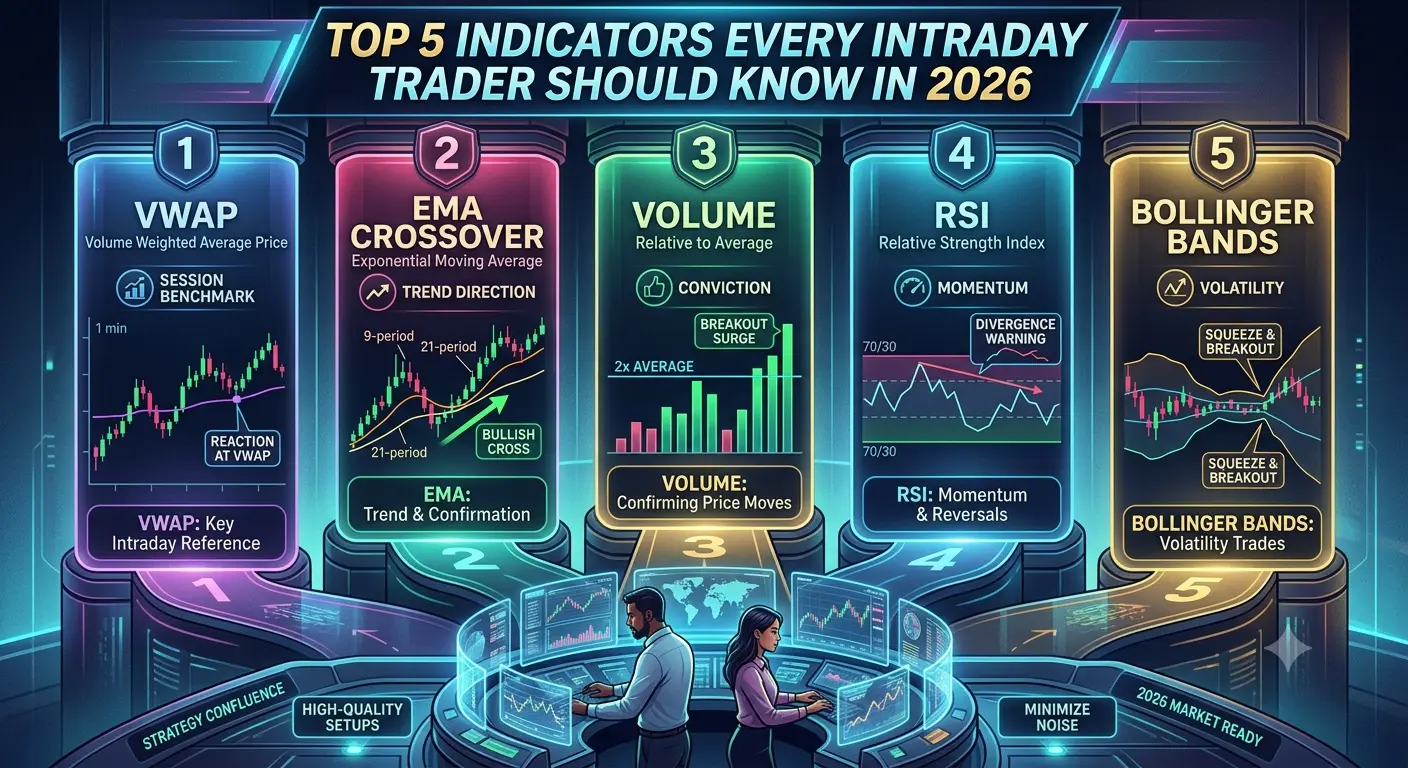
Intraday trading is a trading style where a trader buys or sells a security and closes the position in the same trading session. Due to this, traders need to react fast and make decisions within a short period. Traders use indicators to analyse the market quickly and make decisions based on the data and not on a random guess. While no technical indicator can predict the market with certainty, the right tools can help traders understand momentum, trends, volatility, and potential entry or exit points.
Many beginners struggle to find the right indicators for intraday trading. Using too many indicators can create conflicting signals, while relying on only one may provide an incomplete picture of the market. This article explains the top 5 indicators that professional traders rely on most.
The Exponential Moving Average (EMA) is a type of moving average that gives greater importance to recent price movements. Because it reacts more quickly to new market data than a Simple Moving Average (SMA), many intraday traders prefer using EMA to identify short-term trends and potential trading opportunities. This is also one of the most used stock market indicators.
9 EMA and 20 EMA are commonly used settings for intraday trading. If the price is consistently trading above the EMA it may signal bullish momentum. If the price is below the EMA it may signal bearish sentiment. Traders usually look for crossovers between two EMAs, as they may signal a possible change in trend.
The Relative Strength Index, or RSI, is a momentum indicator that measures the speed and magnitude of recent price movements. It is displayed on a scale from 0 to 100.
Traditionally, readings above 70 suggest that an asset may be overbought, while readings below 30 indicate it may be oversold. However, traders generally use RSI alongside price action rather than treating these levels as automatic buy or sell signals.
Although technically not a price indicator, trading volume is one of the most important pieces of market information.
Volume shows the number of shares or contracts traded during a specific period. Strong price movements supported by higher trading volume often indicate greater market participation, while breakouts occurring on low volume may be less reliable.
The Volume Weighted Average Price (VWAP) compute the average trading price of a security while considering both price and trading volume throughout the day.
Many institutional traders use VWAP as a benchmark to assess whether a stock is trading above or below its average traded price. Intraday traders often interpret prices above VWAP as a sign of relatively stronger buying interest and prices below VWAP as an indication of comparatively weaker momentum.
MACD is a trend-following momentum indicator that helps traders identify changes in trend strength and momentum.
It consists of the MACD line, the signal line, and a histogram. When the MACD line crosses the signal line from below, some traders interpret it as a possible bullish signal. A crossover below the signal line may indicate weakening momentum.
Technical indicators help intraday traders organise market information and make more structured trading decisions. They provide useful information which can support the trader's decision. They help traders to identify trend, momentum and breakout signals.
Although the indicators provide data-based signals, they are not perfect. Along with indicators, traders should also focus on understanding how each tool works and how different indicators complement one another. To learn more, enroll in Upsurge.club’s technical analysis courses.

 Register & Login